Introduction
Financial markets are platforms where buyers and sellers come together to trade financial assets like stocks, bonds, currencies, and commodities. These markets play a crucial role in the economy by facilitating the flow of capital and enabling price discovery, risk management, and the allocation of resources.
Types of Financial Markets
- Stock Market: A market where shares of publicly listed companies are bought and sold. Examples include the New York Stock Exchange (NYSE) and Nasdaq.
- Bond Market: This market deals with the buying and selling of debt securities, primarily bonds issued by corporations, municipalities, and governments.
- Commodities Market: A market where raw materials like gold, oil, and agricultural products are traded. Major examples include the Chicago Mercantile Exchange (CME) and the London Metal Exchange (LME).
- Forex Market: Also known as the foreign exchange market, it’s where currencies are traded. The Forex market is the largest and most liquid financial market in the world.
- Derivatives Market: A market for financial contracts (such as options and futures) that derive their value from an underlying asset, like stocks, bonds, or commodities.
Portfolio of Stocks
A portfolio is a collection of financial assets such as stocks, bonds, and other securities owned by an individual or institution. Diversifying a portfolio—investing in a variety of assets—can help reduce risk. For instance, if one stock underperforms, gains in another might offset the loss, leading to a more stable return.
Python Examples
I’ll assume you already know the basic of python programming. Thus, I recommend creating a python environment python -m venv venv and then installing the libraries shown below
pip install yfinance pandas matplotlibLet’s analyze a basic basic example of fetching historical stock data using the yfinance library.
import yfinance as yf
import matplotlib.pyplot as plt

# Fetching data for Apple, Microsoft, and Google
stocks = ['AAPL', 'MSFT', 'GOOGL']
data = yf.download(stocks, start="2023-01-01", end="2024-01-01")

# Plotting the closing prices
data['Close'].plot(figsize=(10, 7))
plt.title("Stock Prices")
plt.xlabel("Date")
plt.ylabel("Price (USD)")
plt.show()
At the moment I executed the code above I got the following image
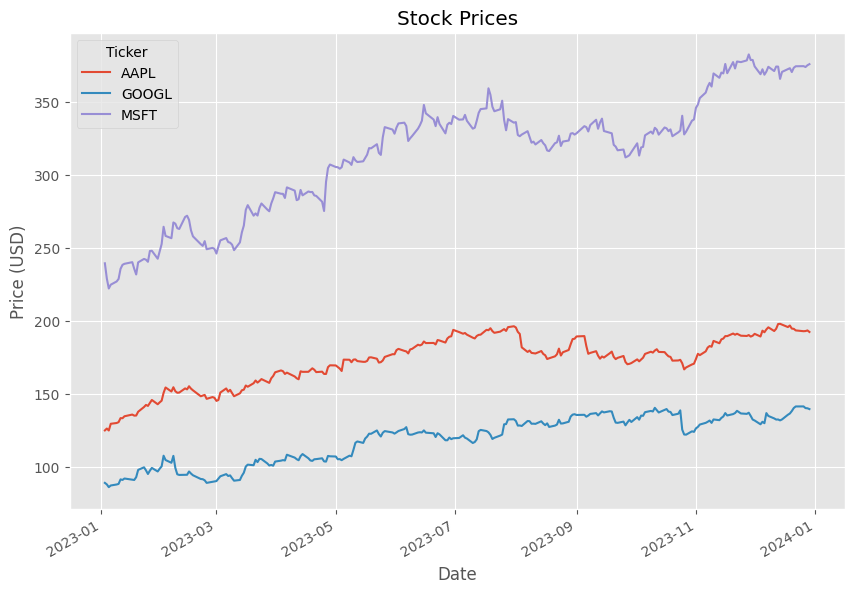
We can see from the image above that, as stated in our code, we are retrieving the stock values for the companies Apple, Google, and Microsoft for the period starting on ‘2023-01-01’ and ending on ‘2024-01-01’
Why AAPL, MSFT, GOOGL though?
A ticker symbol is a unique series of letters assigned to a security or stock for trading purposes. This symbol serves as an abbreviation that identifies a particular stock on a stock exchange. Here’s a breakdown of ticker symbols for some well-known companies:
- AAPL: This is the ticker symbol for Apple Inc., one of the world’s largest technology companies known for products like the iPhone, iPad, and Mac computers.
- MSFT: This symbol represents Microsoft Corporation, a leading technology company specializing in software, personal computers, and services like Azure cloud computing.
- GOOGL: Alphabet Inc. uses this ticker for its Class A shares. Alphabet is the parent company of Google, the world’s leading search engine and digital advertising platform.
- AMZN: This is the ticker for Amazon.com, Inc., a major player in e-commerce, cloud computing, and streaming services.
- NFLX: The ticker symbol for Netflix, Inc., a leading streaming entertainment service provider, is NFLX.
- FB: Meta Platforms, Inc. (formerly Facebook, Inc.) trades under this symbol, representing one of the largest social media and technology companies.
- NVDA: NVIDIA Corporation uses this ticker. NVIDIA is a leading manufacturer of graphics processing units (GPUs) for gaming and professional markets, as well as system on a chip units for mobile devices and automotive markets.
These ticker symbols are essential for investors, analysts, and traders as they provide a quick and easy way to identify and trade stocks on the various stock exchanges around the world.
Portfolio of Stocks
Let’s say now you have a portfolio with equal investments in Apple, Microsoft, and Google. How can you calculate the portfolio’s returns?
Let’s write a python script for this.
import pandas as pd

# Assuming equal weights for each stock
weights = [1/3, 1/3, 1/3]

# Calculate daily returns
returns = data['Close'].pct_change()

# Calculate portfolio returns
portfolio_returns = returns.dot(weights)

# Plotting the portfolio returns
portfolio_returns.plot(figsize=(10, 7))
plt.title("Portfolio Returns")
plt.xlabel("Date")
plt.ylabel("Return")
plt.show()
Then, we obtain the following output image which represents our daily portfolio returns.
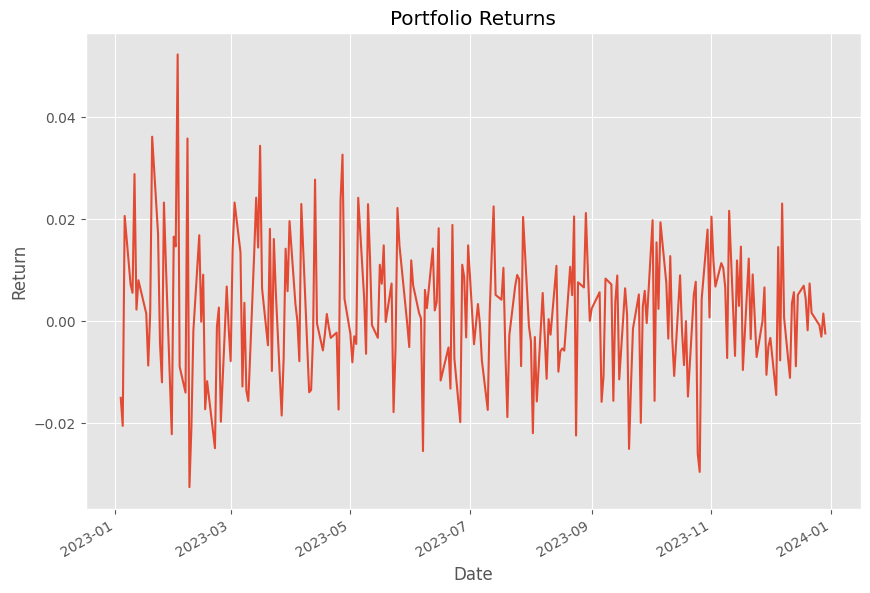
However, this graph above is a bit hard to understand. How could we get a better intuition of what’s happening with our money? Let’s see another script
# Calculating cumulative returns
cumulative_returns = (1 + portfolio_returns).cumprod() - 1

# Calculating mean and standard deviation of returns
mean_return = portfolio_returns.mean()
std_dev = portfolio_returns.std()

print(f"Cumulative Return: {cumulative_returns[-1]:.2%}")
print(f"Average Daily Return: {mean_return:.2%}")
print(f"Volatility (Std Dev): {std_dev:.2%}")
Basically here is what we’re doing.
In financial analysis, it’s essential to evaluate how a portfolio has performed over time. The following metrics are key to understanding the returns and risk associated with a portfolio.
In financial analysis, it’s essential to evaluate how a portfolio has performed over time. The following metrics are key to understanding the returns and risk associated with a portfolio.
1. Cumulative Returns
Cumulative return is a measure of the total return on an investment over a period, assuming all profits are reinvested. It is calculated by multiplying the returns for each period (1 + return), then subtracting 1 at the end.
The formula for cumulative return  over a series of periods is:

Where:
 is the return in period t.
 is the total number of periods.
In the Python code:
cumulative_returns = (1 + portfolio_returns).cumprod() - 1portfolio_returns is a series of daily returns.
(1 + portfolio_returns).cumprod() calculates the cumulative product of 1 + rt over the series, and subtracting 1 gives the cumulative return.
2. Mean Return (Average Daily Return)
The mean return is the average return of the portfolio over a specified period. It provides insight into what an investor might expect to earn per period, on average.
The formula for mean return μ is:

Where:
- rt is the return in period t.
- n is the total number of periods.
In Python:
mean_return = portfolio_returns.mean()portfolio_returns.mean() computes the average of all daily returns.
3. Volatility (Standard Deviation of Returns)
Volatility is a measure of the risk or uncertainty associated with the returns of a portfolio. It is typically measured using the standard deviation, which quantifies how much the returns deviate from the mean return.
The formula for standard deviation  is:
is:

Where:
- is the return in period t.
 is the mean return.
- is the total number of periods.
In Python:
std_dev = portfolio_returns.std()portfolio_returns.std() computes the standard deviation of daily returns.
4. Putting It All Together
Finally, you can print the calculated cumulative return, average daily return, and volatility:
print(f"Cumulative Return: {cumulative_returns[-1]:.2%}")
print(f"Average Daily Return: {mean_return:.2%}")
print(f"Volatility (Std Dev): {std_dev:.2%}")
cumulative_returns[-1] fetches the last value in the cumulative returns series, representing the total cumulative return up to the most recent date.
mean_return and std_dev represent the average daily return and the portfolio’s volatility, respectively.
Summary
- Cumulative Return provides the overall growth of the portfolio, assuming reinvestment of returns.
- Mean Return gives the average return per period, indicating the portfolio’s typical performance.
- Volatility (Standard Deviation) quantifies the risk or variability in returns, with higher volatility indicating greater risk.
Understanding these metrics helps investors assess both the potential reward and the risk associated with a portfolio. For our example then we have the following results:
- Cumulative Return: 57.54%
- Average Daily Return: 0.19%
- Volatility (Std Dev): 1.31%
That’s it for now!
If you’ve made it this far, I want to express my gratitude. I hope this has been helpful to someone other than just me! 🙂